Edit chart
Loading graph
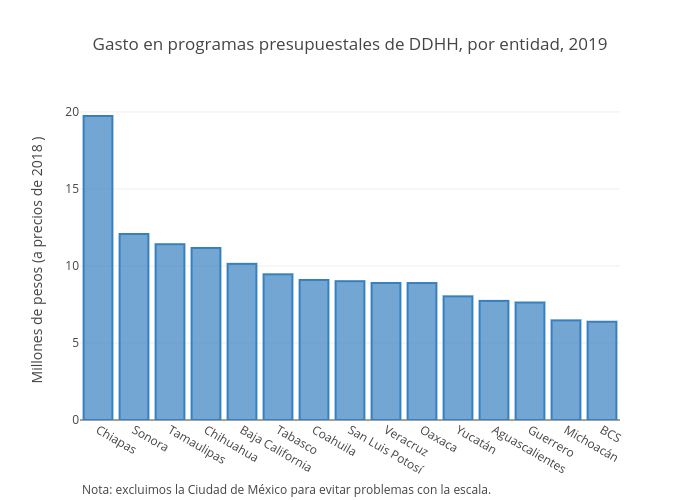
Jjsantos's interactive graph and data of "Gasto en programas presupuestales de DDHH, por entidad, 2019" is a bar chart; with Millones de pesos (a precios de 2018 ) in the y-axis. The x-axis shows values from 0 to 0. The y-axis shows values from 0 to 0. This visualization has the following annotation: Nota: excluimos la Ciudad de México para evitar problemas con la escala.