Edit chart
Loading graph
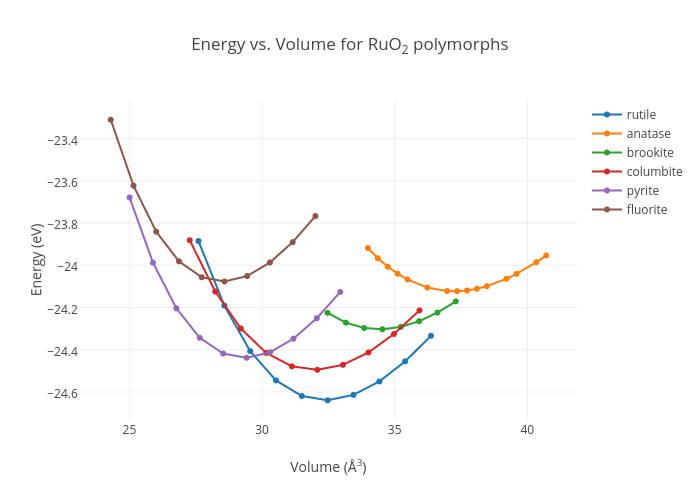
Jkitchin's interactive graph and data of "Energy vs. Volume for RuO2 polymorphs" is a line chart, showing rutile, anatase, brookite, columbite, pyrite, fluorite; with Volume (Å3) in the x-axis and Energy (eV) in the y-axis.. The x-axis shows values from 0 to 0. The y-axis shows values from 0 to 0.