Edit chart
Loading graph
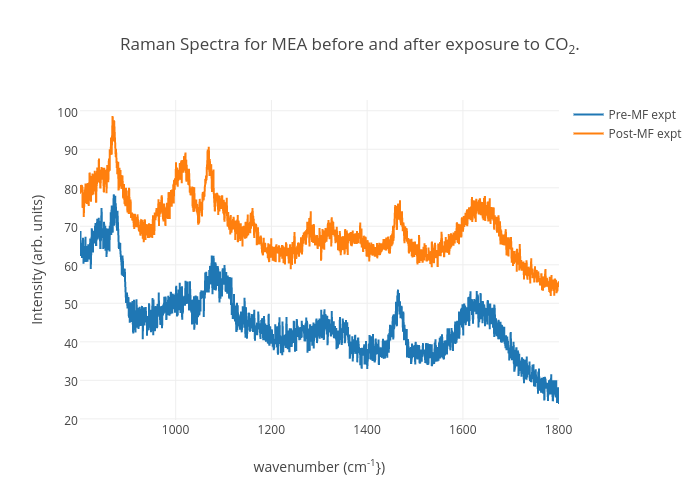
Jkitchin's interactive graph and data of "Raman Spectra for MEA before and after exposure to CO2." is a line chart, showing Pre-MF expt vs Post-MF expt; with wavenumber (cm-1}) in the x-axis and Intensity (arb. units) in the y-axis.. The x-axis shows values from 0 to 0. The y-axis shows values from 0 to 0.