Edit chart
Loading graph
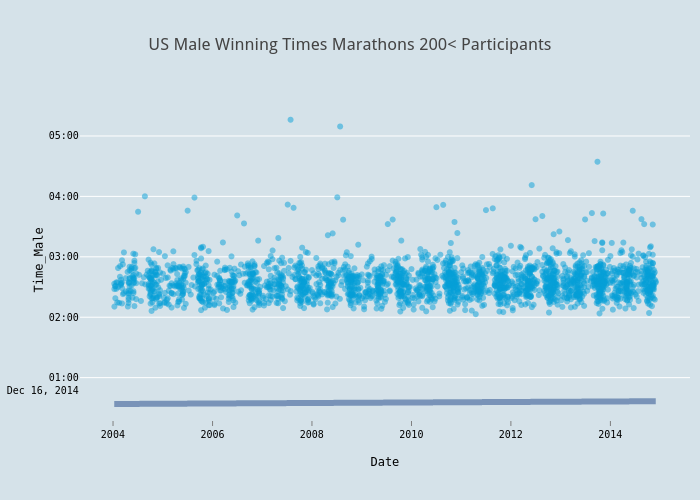
Jlebeau's interactive graph and data of "US Male Winning Times Marathons 200< Participants" is a scatter chart, showing None vs null - fit; with Date in the x-axis and Time_Male in the y-axis.. The x-axis shows values from 1052531813148.789 to 1438452186851.2112. The y-axis shows values from 1418687343826.8843 to 1418700605173.1157.