Edit chart
Loading graph
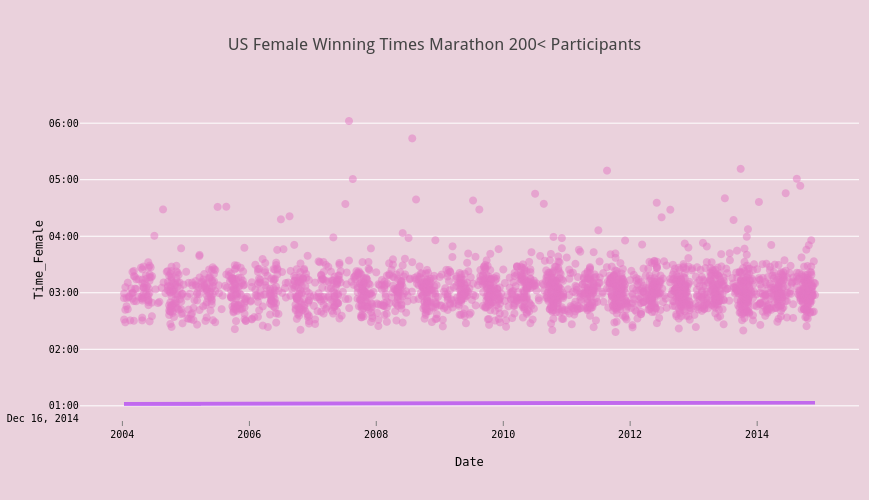
Jlebeau's interactive graph and data of "US Female Winning Times Marathon 200< Participants" is a scatter chart, showing None vs null - fit; with Date in the x-axis and Time_Female in the y-axis.. The x-axis shows values from 1051833794819.8524 to 1439150205180.1477. The y-axis shows values from 1418688084899.2805 to 1418703553100.7195.