Edit chart
Loading graph
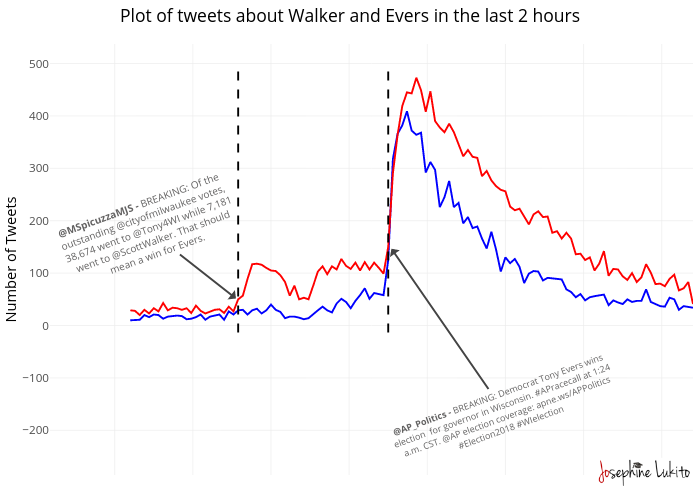
Jlukito's interactive graph and data of "Plot of tweets about Walker and Evers in the last 2 hours" is a line chart; with Number of Tweets in the y-axis. The x-axis shows values from 1541572200 to 1541579400. The y-axis shows values from -123.46620887602299 to 528.7613794145275. This visualization has the following annotations: @MSpicuzzaMJS - BREAKING: Of theoutstanding @cityofmilwaukee votes, 38,674 went to @Tony4WI while 7,181 went to @ScottWalker. That should mean a win for Evers.; @AP_Politics - BREAKING: Democrat Tony Evers winselection for governor in Wisconsin. #APracecall at 1:24 a.m. CST. @AP election coverage: apne.ws/APPolitics #Election2018 #WIelection