Edit chart
Loading graph
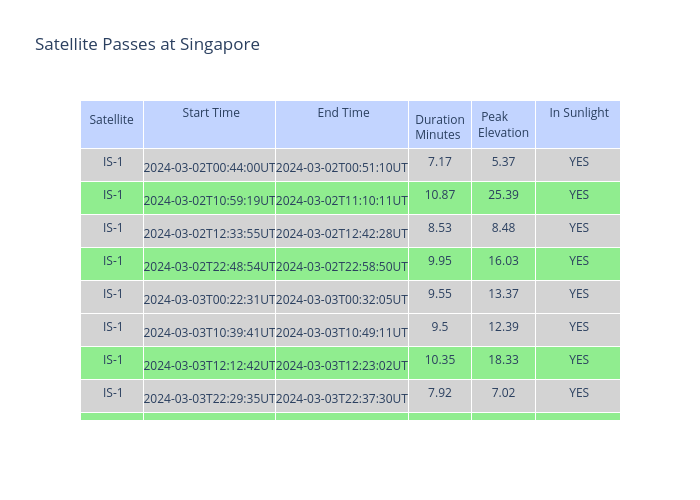
Jmason86's interactive graph and data of "Satellite Passes at Singapore" is a table. The x-axis shows values from 0 to 0. The y-axis shows values from 0 to 0.