Edit chart
Loading graph
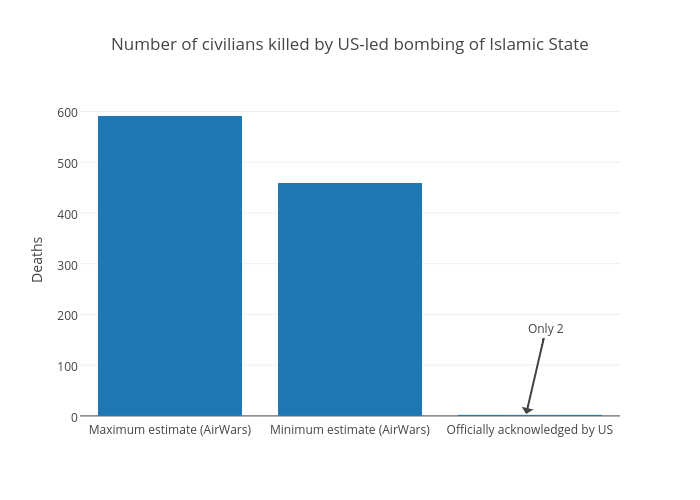
Joedyke's interactive graph and data of "Number of civilians killed by US-led bombing of Islamic State" is a bar chart, showing Col2; with Deaths in the y-axis. The x-axis shows values from -0.5 to 2.5. The y-axis shows values from -11.535458685751452 to 622.712392562408. This visualization has the following annotation: Only 2