Edit chart
Loading graph
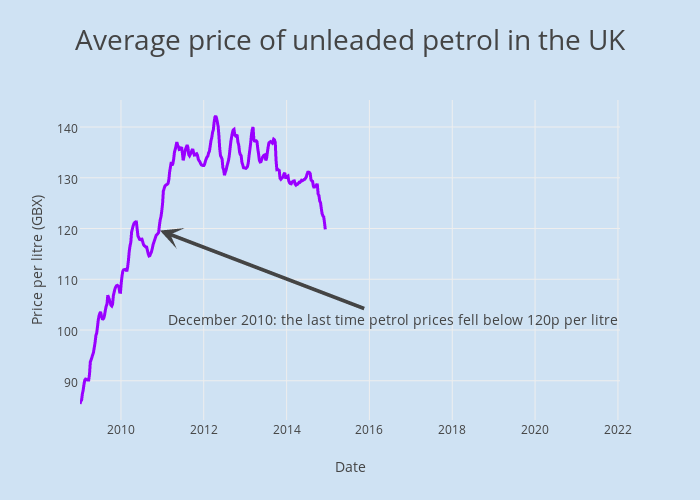
Joehall's interactive graph and data of "Average price of unleaded petrol in the UK" is a scatter chart, showing ULSP; with Date in the x-axis and Price per litre (GBX) in the y-axis.. The x-axis shows values from 1231113600000 to 1417996800000. The y-axis shows values from 82.26978094444443 to 145.32554205555556. This visualization has the following annotation: December 2010: the last time petrol prices fell below 120p per litre