Edit chart
Loading graph
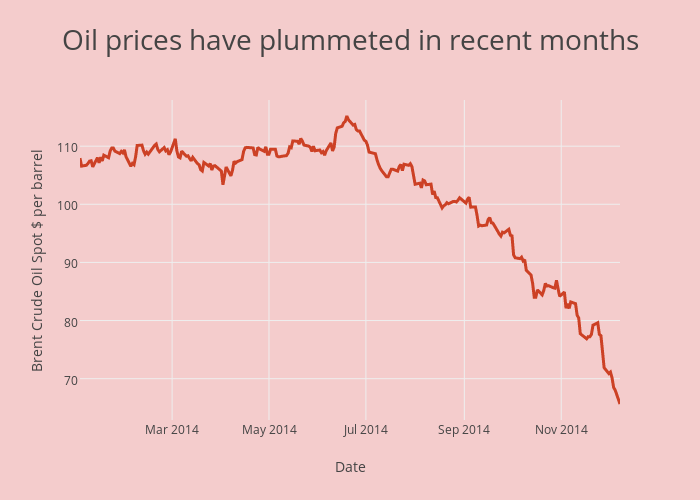
Joehall's interactive graph and data of "Oil prices have plummeted in recent months" is a scatter chart, showing Brent Crude Oil Spot $ per barrel; with Date in the x-axis and Brent Crude Oil Spot $ per barrel in the y-axis.. The x-axis shows values from 1388620800000 to 1417996800000. The y-axis shows values from 62.88722222222222 to 117.94277777777778.