Edit chart
Loading graph
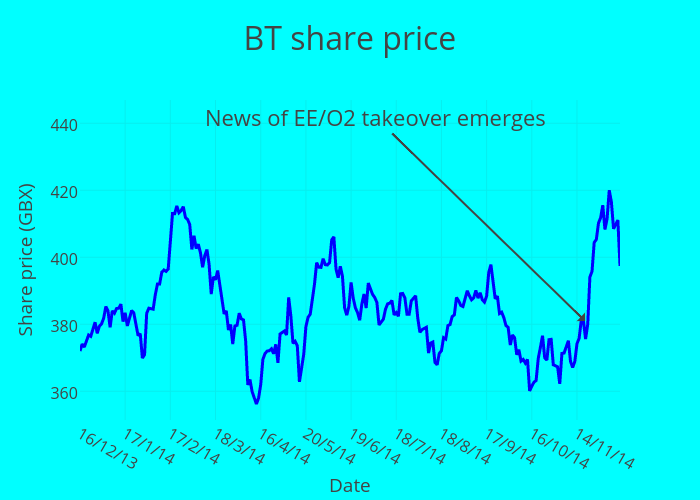
Joehall's interactive graph and data of "BT share price" is a scatter chart, showing Col2; with Date in the x-axis and Share price (GBX) in the y-axis.. The x-axis shows values from 0 to 251. The y-axis shows values from 352.65555555555557 to 423.5444444444444. This visualization has the following annotation: News of EE/O2 takeover emerges