Edit chart
Loading graph
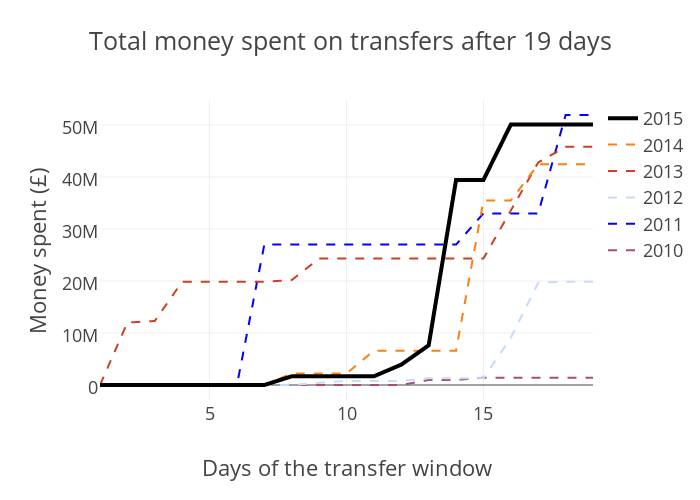
Joehall's interactive graph and data of "Total money spent on transfers after 19 days" is a line chart, showing 2010, 2011, 2012, 2013, 2014, 2015; with Days of the transfer window in the x-axis and Money spent (£) in the y-axis.. The x-axis shows values from 1 to 19. The y-axis shows values from -2884444.4444444445 to 54804444.44444445.