2008
2009
2010
2011
2012
2013
2014
2015
0
20
40
60
80
100
120
140
E-Book
Audio
Paper
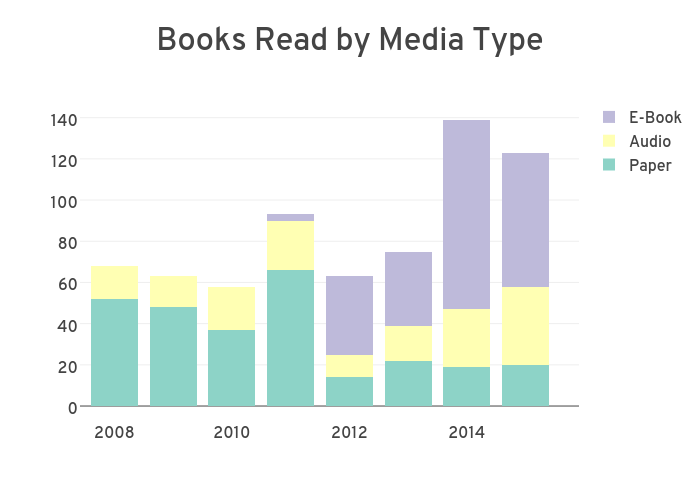
Books Read by Media Type
plotly-logomark
Edit chart
Jolee.stephens's interactive graph and data of "Books Read by Media Type" is a stacked bar chart, showing Paper, Audio, E-Book. The x-axis shows values from 2007.4133669540895 to 2015.9080593264523. The y-axis shows values from -6.788816429768232 to 148.5746361700266.