Edit chart
Loading graph
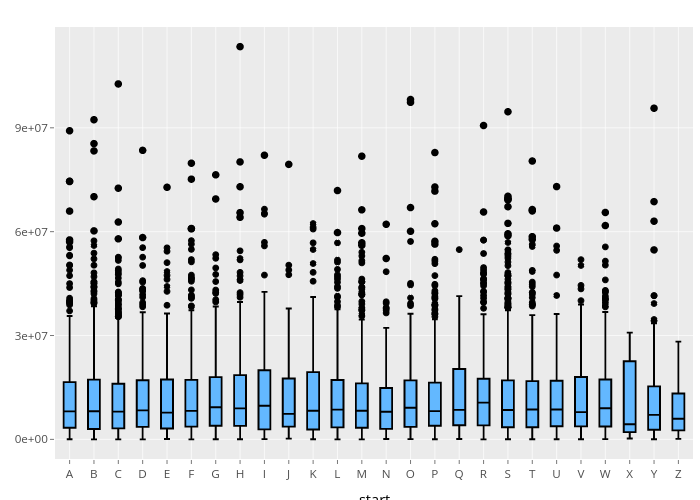
Jonocarroll's interactive graph and data is a box plot. The x-axis shows values from 0.4 to 26.6. The y-axis shows values from -5671859.5 to 119121545.5. This visualization has the following annotations: start; seed