Edit chart
Loading graph
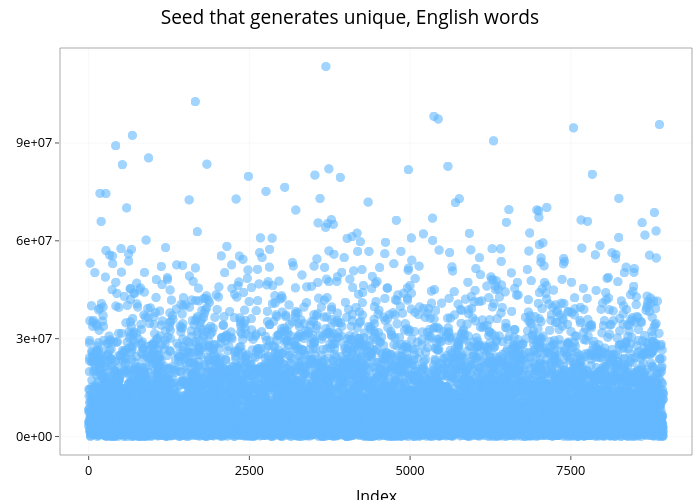
Jonocarroll's interactive graph and data of "Seed that generates unique, English words" is a scatter chart. The x-axis shows values from -445.85 to 9384.85. The y-axis shows values from -5671859.5 to 119121545.5. This visualization has the following annotations: Index; Seed