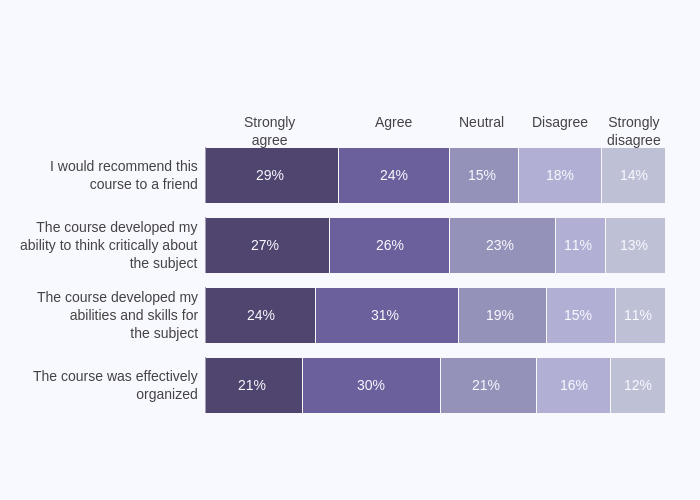
The course was effectively
organized
21%
30%
21%
16%
12%
The course developed my
abilities and skills for
the subject
24%
31%
19%
15%
11%
The course developed my
ability to think critically about
the subject
27%
26%
23%
11%
13%
I would recommend this
course to a friend
29%
Strongly
agree
24%
Agree
15%
Neutral
18%
Disagree
14%
Strongly
disagree
plotly-logomark
Edit chart
Jordanpeterson's interactive graph and data is a stacked bar chart. The x-axis shows values from 0 to 0. The y-axis shows values from 0 to 0. This visualization has the following annotations: The course was effectivelyorganized; 21%; 30%; 21%; 16%; 12%; The course developed myabilities and skills forthe subject; 24%; 31%; 19%; 15%; 11%; The course developed myability to think critically aboutthe subject; 27%; 26%; 23%; 11%; 13%; I would recommend thiscourse to a friend; 29%; Stronglyagree; 24%; Agree; 15%; Neutral; 18%; Disagree; 14%; Stronglydisagree