Edit chart
Loading graph
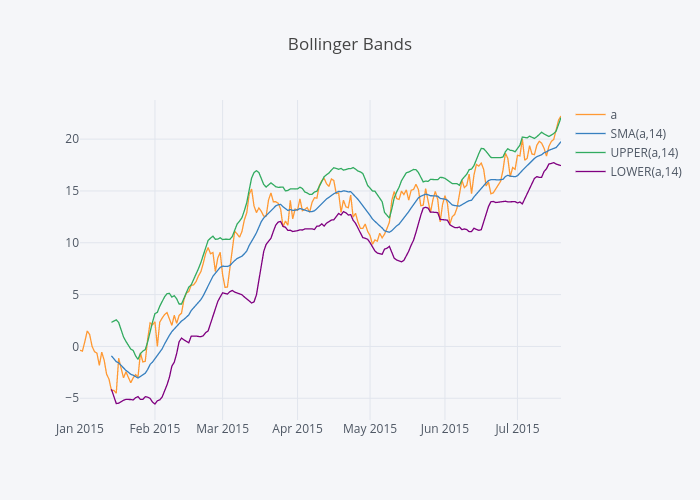
Jorgesantos's interactive graph and data of "Bollinger Bands" is a line chart, showing a, SMA(a,14), UPPER(a,14), LOWER(a,14). The x-axis shows values from 0 to 0. The y-axis shows values from 0 to 0.