Edit chart
Loading graph
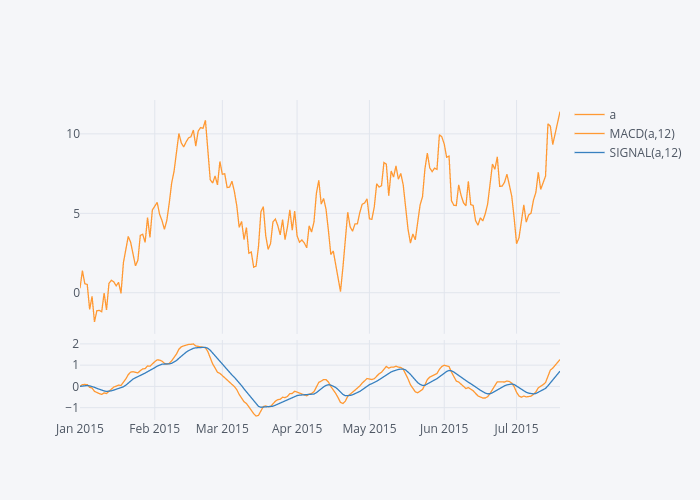
Jorgesantos's interactive graph and data of "a, MACD(a,12), SIGNAL(a,12)" is a line chart, showing a, MACD(a,12), SIGNAL(a,12). The x-axis shows values from 0 to 0. The y-axis shows values from 0 to 0.