Edit chart
Loading graph
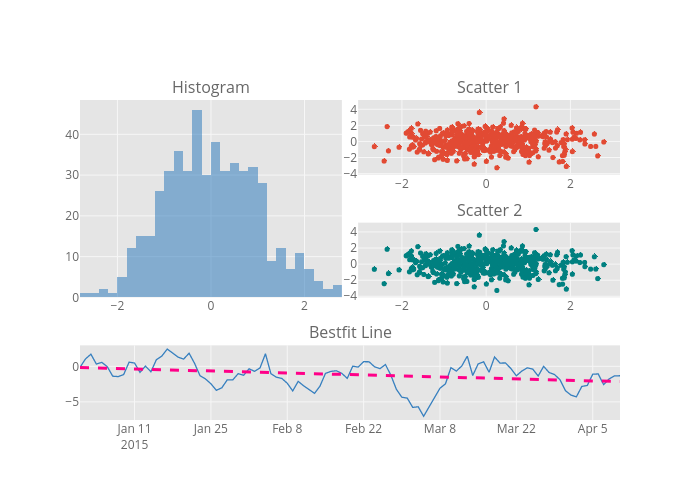
Jorgesantos's interactive graph and data of "x, y, y, a, -0.02*x+-0.16" is a histogram, showing x, y, y, a, -0.02*x+-0.16. The x-axis shows values from 0 to 0. The y-axis shows values from 0 to 0. This visualization has the following annotations: Histogram; Scatter 1; Scatter 2; Bestfit Line