Edit chart
Loading graph
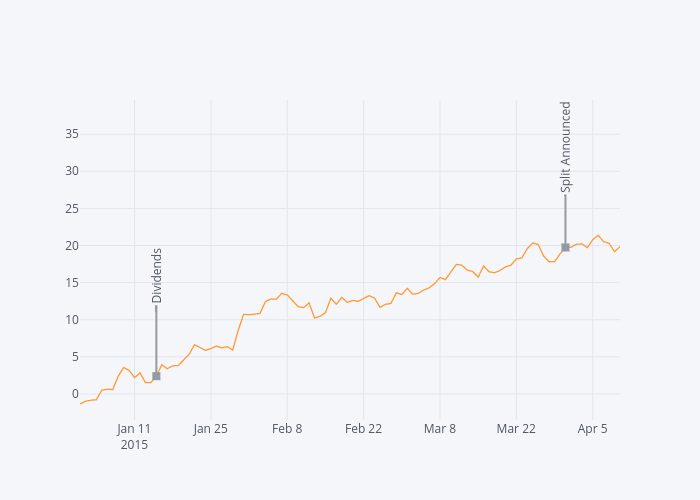
Jorgesantos's interactive graph and data of "MSFT" is a line chart, showing MSFT. The x-axis shows values from 0 to 0. The y-axis shows values from 0 to 0. This visualization has the following annotations: Dividends; Split Announced