Edit chart
Loading graph
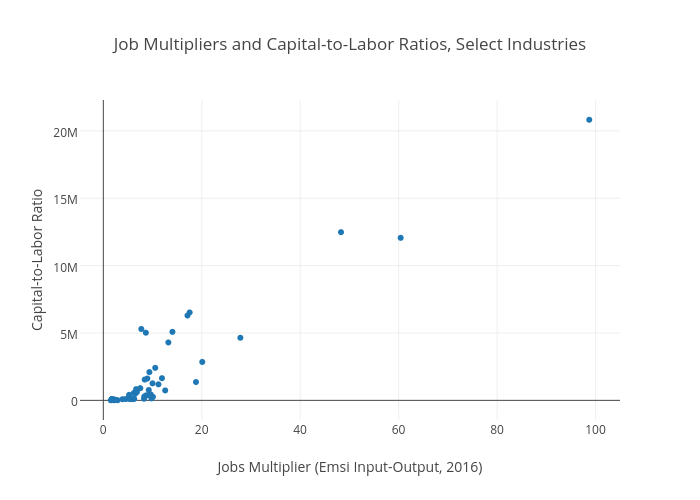
Jpaulwright's interactive graph and data of "Job Multipliers and Capital-to-Labor Ratios, Select Industries" is a scatter chart, showing Column 2; with Jobs Multiplier (Emsi Input-Output, 2016) in the x-axis and Capital-to-Labor Ratio in the y-axis.. The x-axis shows values from -4.558979187314172 to 104.77897918731416. The y-axis shows values from -1488671.006071289 to 22321659.606071286.