4k
6k
6k
6k
8k
8k
8k
8k
8k
8k
8k
8k
10k
10k
10k
10k
10k
10k
10k
10k
10k
10k
12k
12k
12k
12k
12k
12k
12k
12k
12k
12k
12k
12k
12k
12k
14k
14k
14k
14k
14k
14k
14k
1970
1980
1990
2000
2010
10
20
30
40
50
0
2k
4k
6k
8k
10k
12k
14k
16k
18k
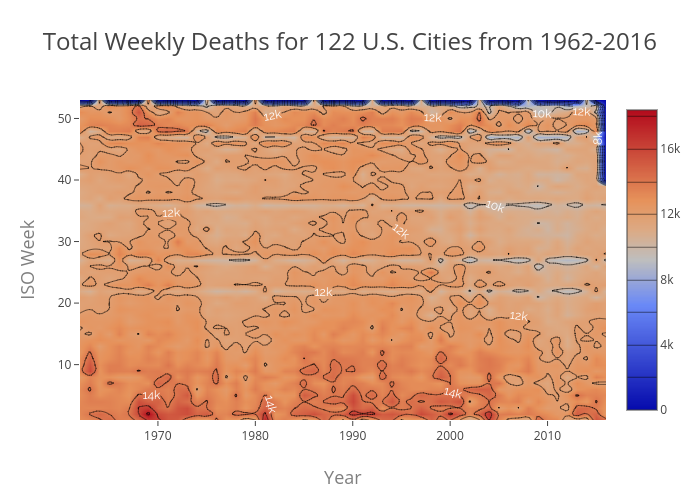
Total Weekly Deaths for 122 U.S. Cities from 1962-2016
Year
ISO Week
plotly-logomark
Edit chart
Jqh5657's interactive graph and data of "Total Weekly Deaths for 122 U.S. Cities from 1962-2016" is a contour; with Year in the x-axis and ISO Week in the y-axis.. The x-axis shows values from 0 to 0. The y-axis shows values from 0 to 0.