0
5
10
15
20
150
160
170
180
190
200
210
220
1.5
2
2.5
3
3.5
13
14
15
16
17
18
Wind Direction [Degrees]
Wind Velocity [m/s]
Temperature [C]
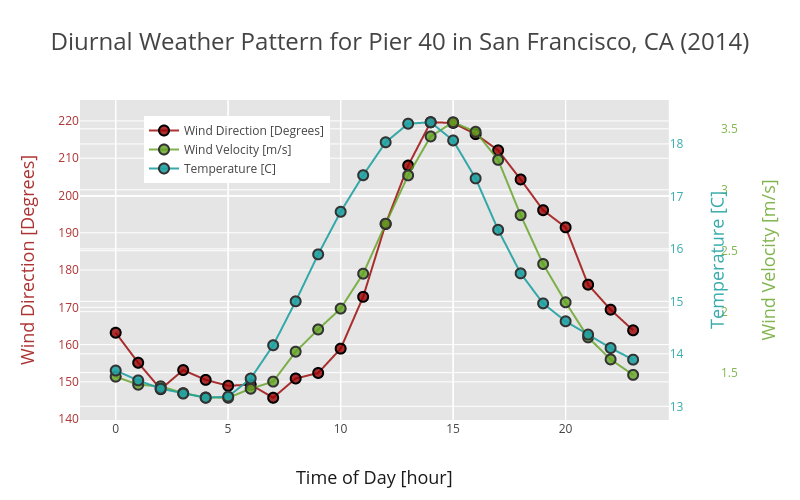
Diurnal Weather Pattern for Pier 40 in San Francisco, CA (2014)
Time of Day [hour]
Wind Direction [Degrees]
Wind Velocity [m/s]
Temperature [C]
plotly-logomark
Edit chart
Jqh5657's interactive graph and data of "Diurnal Weather Pattern for Pier 40 in San Francisco, CA (2014)" is a line chart, showing Wind Direction [Degrees], Wind Velocity [m/s], Temperature [C]; with Time of Day [hour] in the x-axis and Wind Direction [Degrees] in the y-axis.. The x-axis shows values from 0 to 0. The y-axis shows values from 0 to 0.