0
5
10
15
20
1
1.5
2
2.5
3
3.5
4
4.5
5
January
February
March
April
May
June
July
August
September
October
November
December
Seasonal Diurnal Plots of Wind Velocity in San Francisco (2014)
Time of Day [hour]
Wind Velocity [m/s]
plotly-logomark
Edit chart
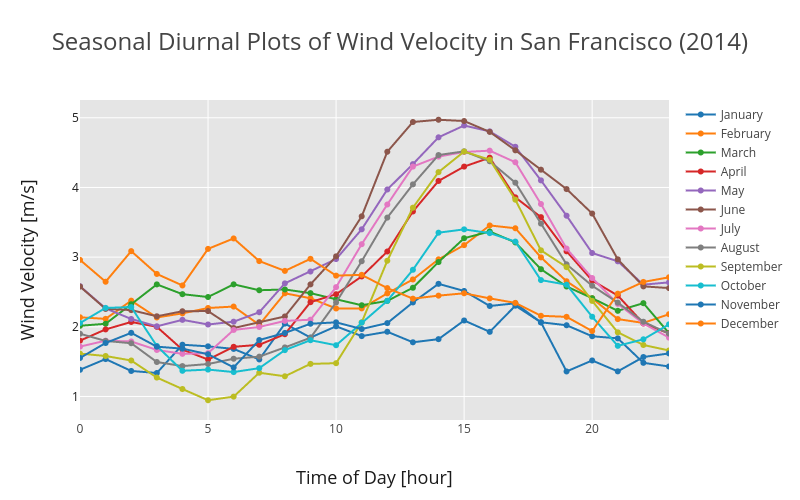
Jqh5657's interactive graph and data of "Seasonal Diurnal Plots of Wind Velocity in San Francisco (2014)" is a line chart, showing January, February, March, April, May, June, July, August, September, October, November, December; with Time of Day [hour] in the x-axis and Wind Velocity [m/s] in the y-axis.. The x-axis shows values from 0 to 23. The y-axis shows values from 0 to 0.