0
50
100
150
200
−0.8
−0.6
−0.4
−0.2
0
0.2
0.4
0.6
0.8
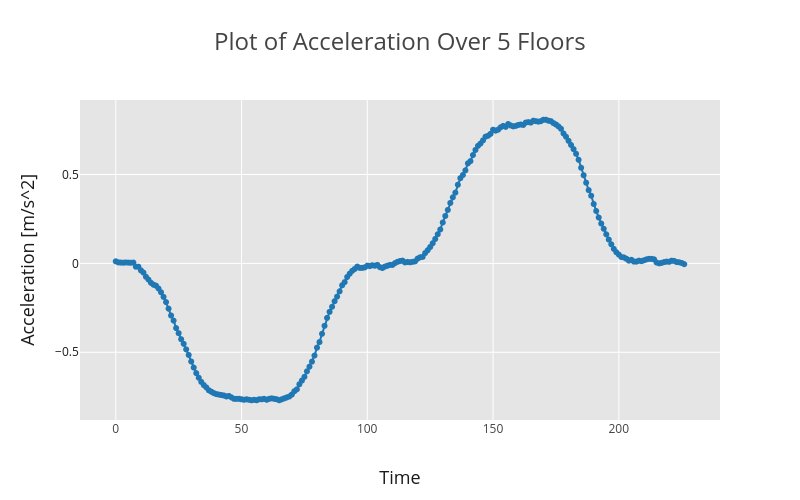
Plot of Acceleration Over 5 Floors
Time
Acceleration [m/s^2]
plotly-logomark
Edit chart
Jqh5657's interactive graph and data of "Plot of Acceleration Over 5 Floors" is a line chart, showing Plot of Ground to 13th Floor Acceleration in y-direction; with Time in the x-axis and Acceleration [m/s^2] in the y-axis.. The x-axis shows values from -14.211961301671064 to 240.21196130167107. The y-axis shows values from -0.8721714096624744 to 0.9101714096624762.