Jan 2014
Mar 2014
May 2014
Jul 2014
Sep 2014
Nov 2014
Jan 2015
300
400
500
600
700
800
900
1000
1100
1200
0
1
2
3
4
5
collisions
deaths
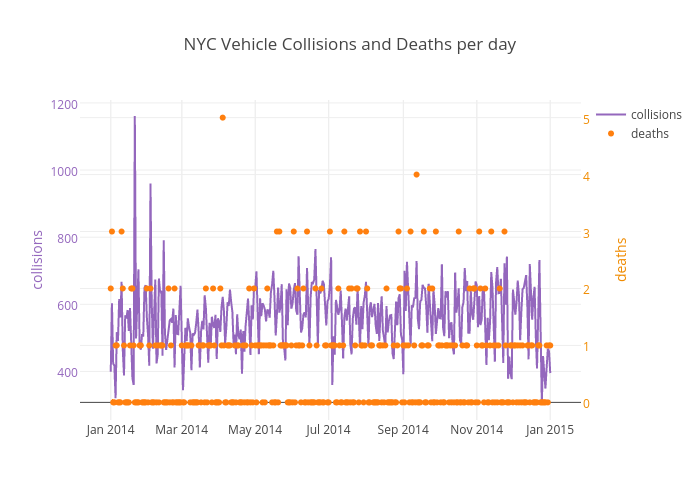
NYC Vehicle Collisions and Deaths per day
collisions
deaths
plotly-logomark
Edit chart
Jsanch's interactive graph and data of "NYC Vehicle Collisions and Deaths per day" is a scatter chart, showing collisions vs deaths; with time in the x-axis and collisions in the y-axis.. The x-axis shows values from 1386599758680.7146 to 1422041041319.2854. The y-axis shows values from 255.33333333333337 to 1208.6666666666667.