Edit chart
Loading graph
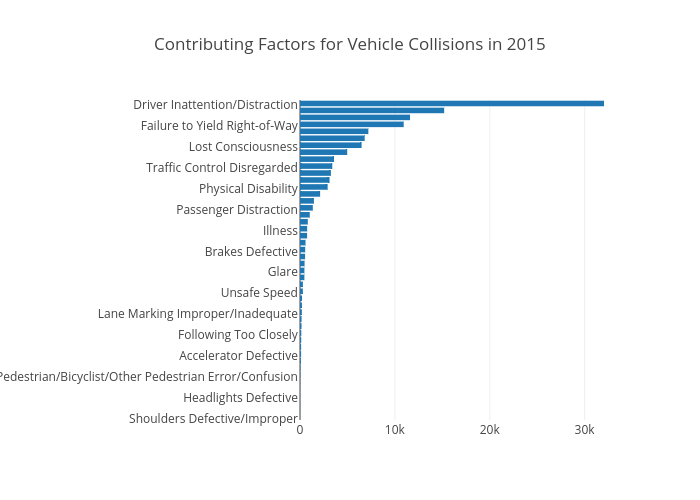
Jsanch's interactive graph and data of "Contributing Factors for Vehicle Collisions in 2015" is a bar chart, showing y. The x-axis shows values from 0 to 33720. The y-axis shows values from -0.5 to 45.5.