Edit chart
Loading graph
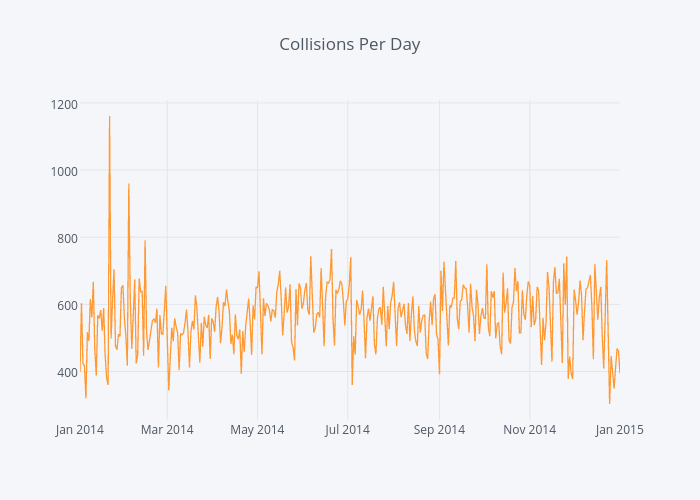
Jsanch's interactive graph and data of "Collisions Per Day" is a line chart, showing date. The x-axis shows values from 1388552400000 to 1420088400000. The y-axis shows values from 255.33333333333331 to 1208.6666666666667.