Edit chart
Loading graph
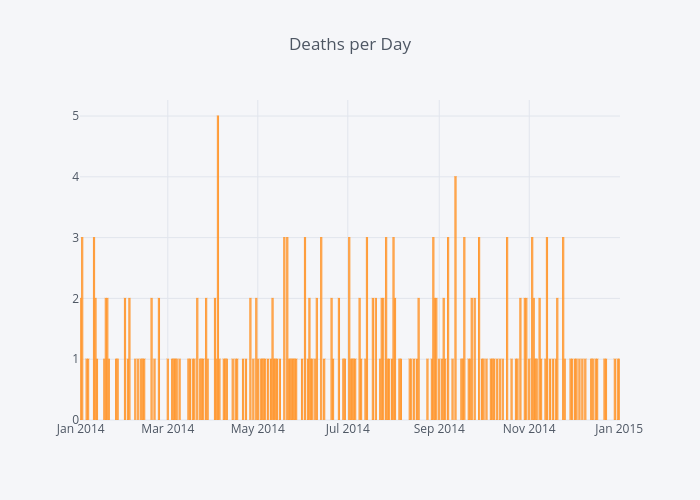
Jsanch's interactive graph and data of "Deaths per Day" is a bar chart, showing number_of_persons_killed. The x-axis shows values from 1388511000000 to 1420129800000. The y-axis shows values from 0 to 5.2631578947368425.