Edit chart
Loading graph
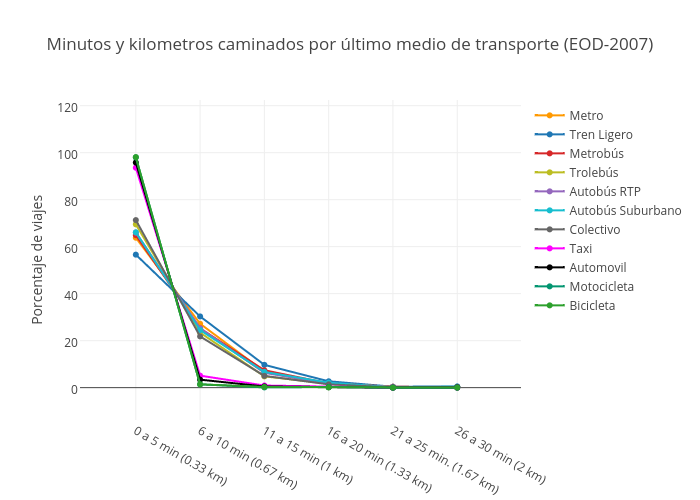
Jsmanuel.landin's interactive graph and data of "Minutos y kilometros caminados por último medio de transporte (EOD-2007)" is a scatter chart, showing Metro, Tren Ligero, Metrobús, Trolebús, Autobús RTP, Autobús Suburbano, Colectivo, Taxi, Automovil, Motocicleta, Bicicleta; with Porcentaje de viajes in the y-axis. The x-axis shows values from -0.8685054688178409 to 5.992293468371581. The y-axis shows values from -13.772102847472745 to 122.41150587263327.