Edit chart
Loading graph
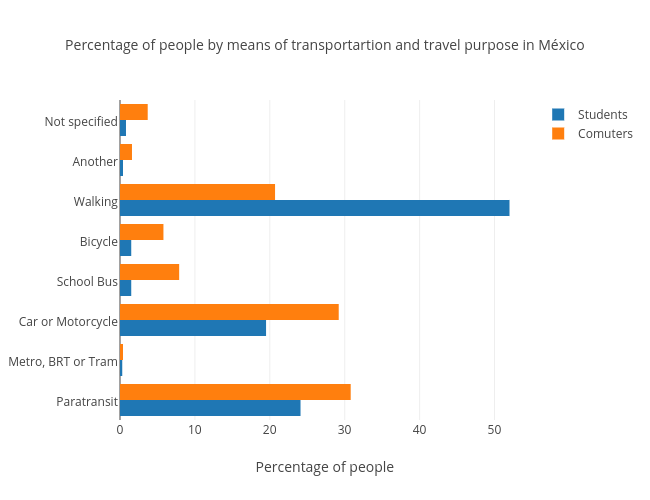
Jsmanuel.landin's interactive graph and data of "Percentage of people by means of transportartion and travel purpose in México" is a bar chart, showing Students vs Comuters; with Percentage of people in the x-axis. The x-axis shows values from 0 to 54.73684210526316. The y-axis shows values from -0.5 to 7.5.