Edit chart
Loading graph
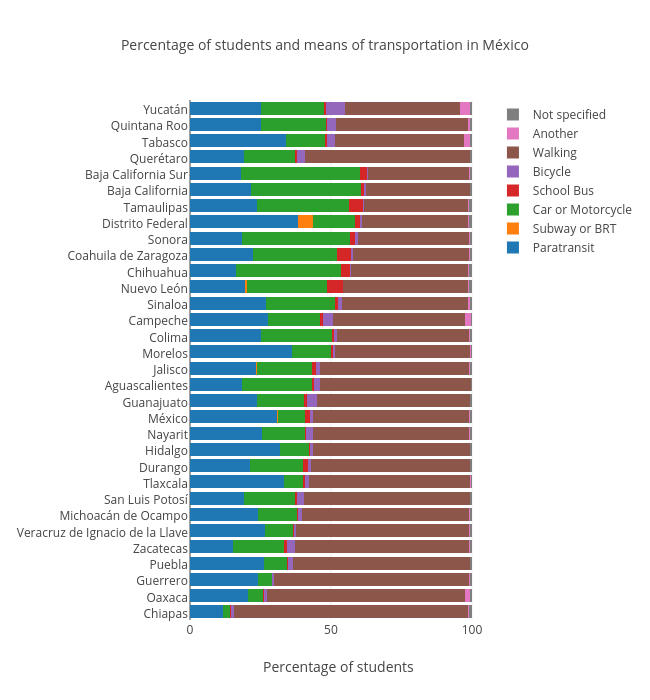
Jsmanuel.landin's interactive graph and data of "Percentage of students and means of transportation in México" is a stacked bar chart, showing Paratransit, Subway or BRT, Car or Motorcycle, School Bus, Bicycle, Walking, Another, Not specified; with Percentage of students in the x-axis. The x-axis shows values from 0 to 105.2842105263158. The y-axis shows values from -0.5 to 31.5.