Edit chart
Loading graph
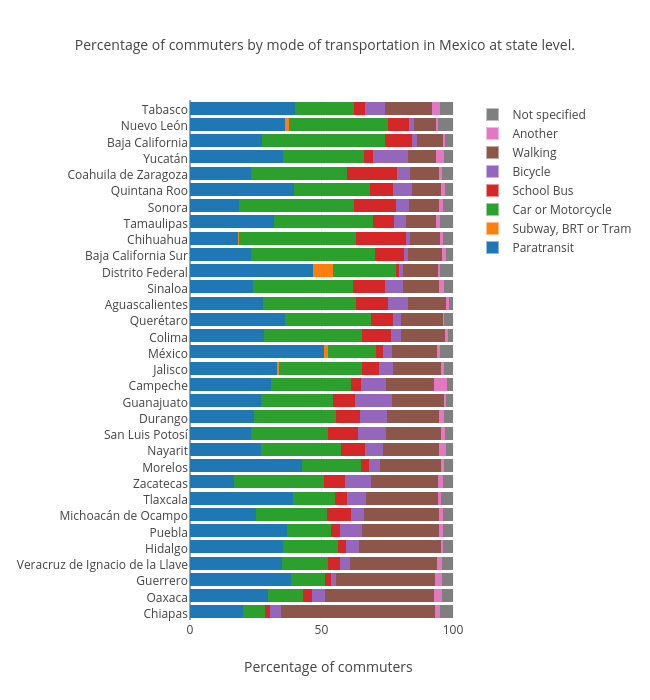
Jsmanuel.landin's interactive graph and data of "Percentage of commuters by mode of transportation in Mexico at state level." is a stacked bar chart, showing Paratransit, Subway, BRT or Tram, Car or Motorcycle, School Bus, Bicycle, Walking, Another, Not specified; with Percentage of commuters in the x-axis. The x-axis shows values from 0 to 105.27368421052633. The y-axis shows values from -0.5 to 31.5.