Edit chart
Loading graph
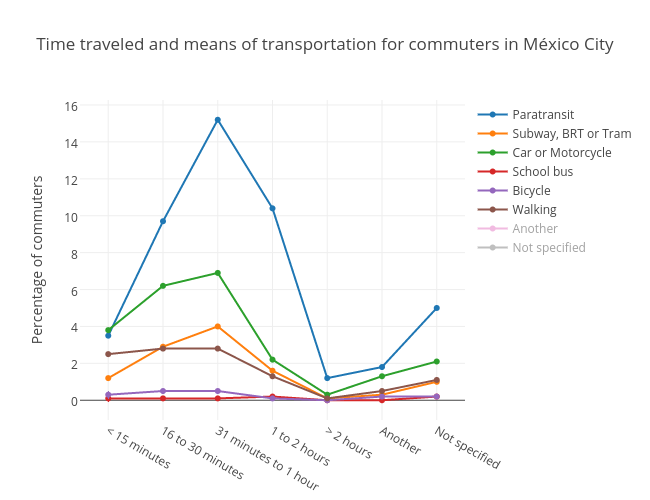
Jsmanuel.landin's interactive graph and data of "Time traveled and means of transportation for commuters in México City" is a scatter chart, showing Paratransit, Subway, BRT or Tram, Car or Motorcycle, School bus, Bicycle, Walking, Another, Not specified; with Percentage of commuters in the y-axis. The x-axis shows values from -0.4068843777581642 to 6.406884377758164. The y-axis shows values from -1.0702317290552583 to 16.270231729055258.