Edit chart
Loading graph
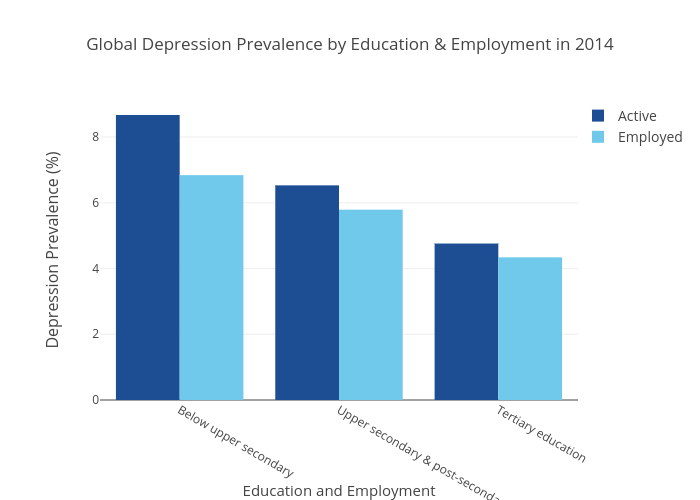
Judy.gong's interactive graph and data of "Global Depression Prevalence by Education & Employment in 2014" is a grouped bar chart, showing Active vs Employed; with Education and Employment in the x-axis and Depression Prevalence (%) in the y-axis.. The x-axis shows values from -0.5 to 2.5. The y-axis shows values from 0 to 9.126315789473685.