Edit chart
Loading graph
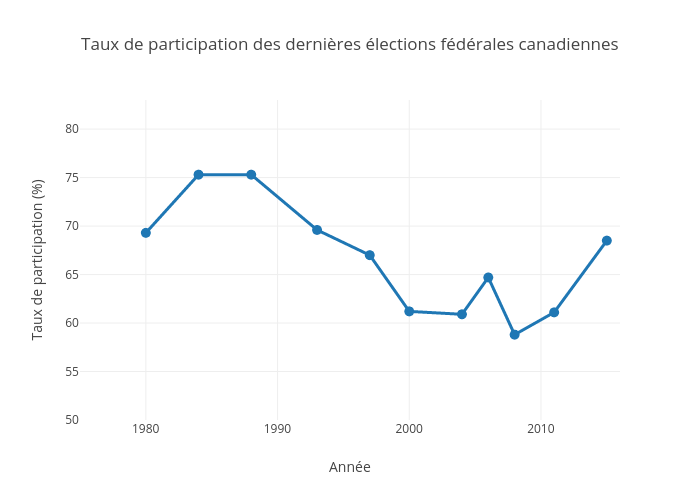
Julien.lamoureux's interactive graph and data of "Taux de participation des dernières élections fédérales canadiennes" is a scatter chart, showing y; with Année in the x-axis and Taux de participation (%) in the y-axis.. The x-axis shows values from 1975 to 2016. The y-axis shows values from 50 to 83.