Edit chart
Loading graph
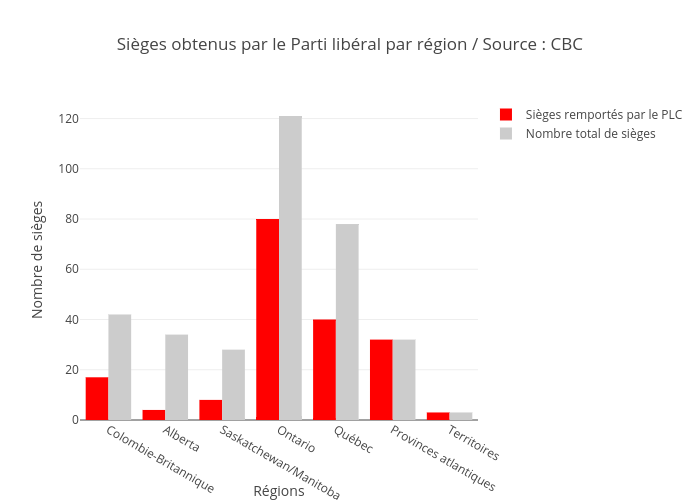
Julien.lamoureux's interactive graph and data of "Sièges obtenus par le Parti libéral par région / Source : CBC" is a bar chart, showing Sièges remportés par le PLC vs Nombre total de sièges; with Régions in the x-axis and Nombre de sièges in the y-axis.. The x-axis shows values from -0.5 to 6.5. The y-axis shows values from 0 to 127.36842105263158.