Edit chart
Loading graph
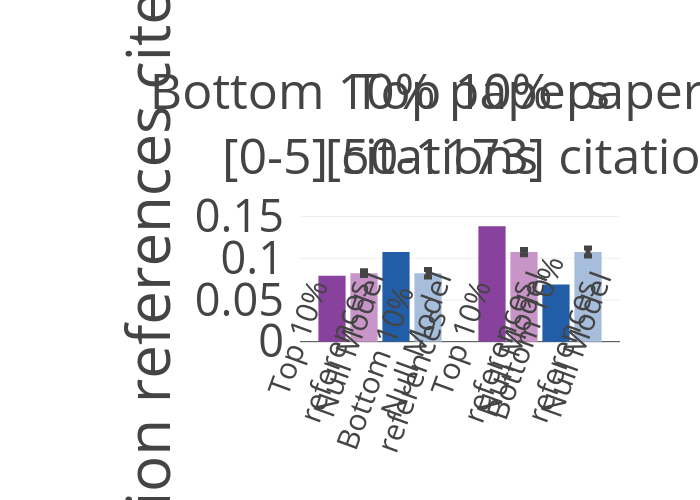
Juliettapc's interactive graph and data is a bar chart; with Fraction references cited in the y-axis. The x-axis shows values from -0.5 to 1.5. The y-axis shows values from -0.07 to 0.17. This visualization has the following annotations: Top 10%references; Null Model; Bottom 10%references; Null Model; Top 10%references; Null Model; Bottom 10%references; Null Model