Edit chart
Loading graph
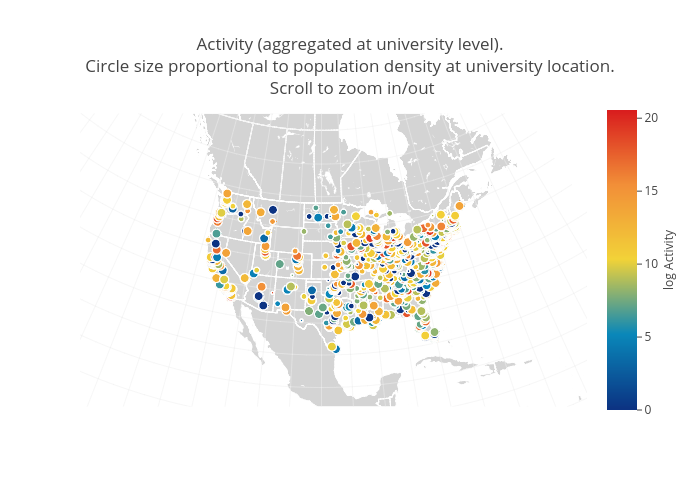
Juliettapc's interactive graph and data of "Activity (aggregated at university level).Circle size proportional to population density at university location. Scroll to zoom in/out" is a scattergeo. The x-axis shows values from 0 to 0. The y-axis shows values from 0 to 0.