Edit chart
Loading graph
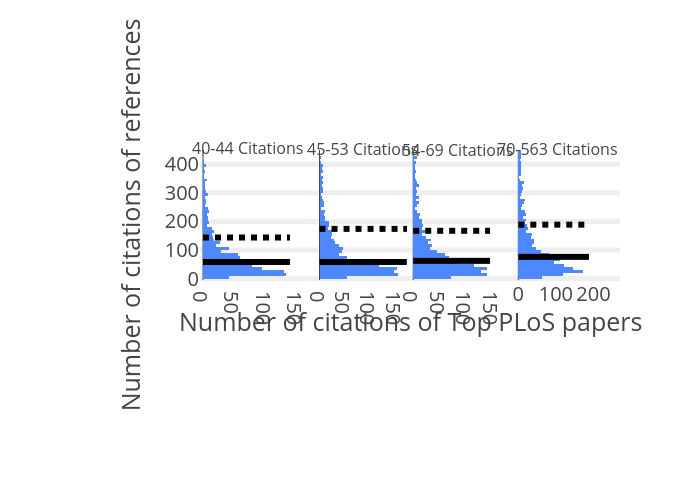
Juliettapc's interactive graph and data of "Number of citations of references vs {'font': {'size': 20}}" is a histogram, showing 40-45 citations, N:1107, 45-54 citations, N:1449, 54-70 citations, N:1417, 70-564 citations, N:1766; with {'font': {'size': 20}} in the x-axis and Number of citations of references in the y-axis.. The x-axis shows values from -2.3566045679699577 to 141.35660456796995. The y-axis shows values from -5 to 450. This visualization has the following annotations: Number of citations of Top PLoS papers; 40-44 Citations; 45-53 Citations; 54-69 Citations; 70-563 Citations