Edit chart
Loading graph
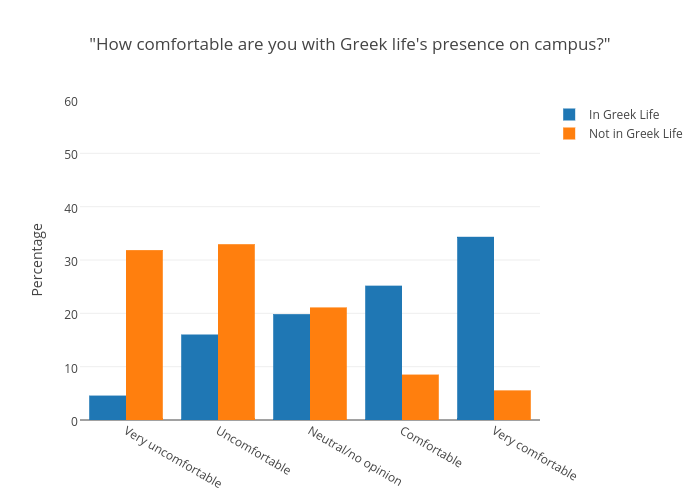
Juliettehainline's interactive graph and data of ""How comfortable are you with Greek life's presence on campus?"" is a bar chart, showing In Greek Life vs Not in Greek Life; with Percentage in the y-axis. The x-axis shows values from -0.5 to 4.5. The y-axis shows values from 0 to 60.