Edit chart
Loading graph
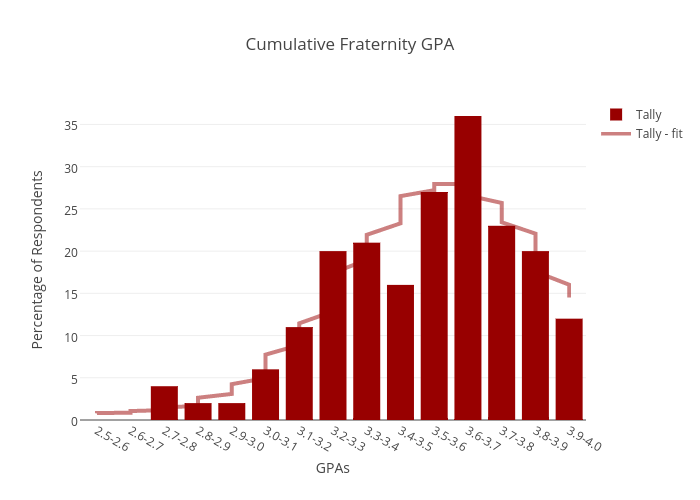
Juliettehainline's interactive graph and data of "Cumulative Fraternity GPA" is a bar chart, showing Tally vs Tally - fit; with GPAs in the x-axis and Percentage of Respondents in the y-axis.. The x-axis shows values from -0.5 to 14.5. The y-axis shows values from 0 to 37.89473684210526.