Edit chart
Loading graph
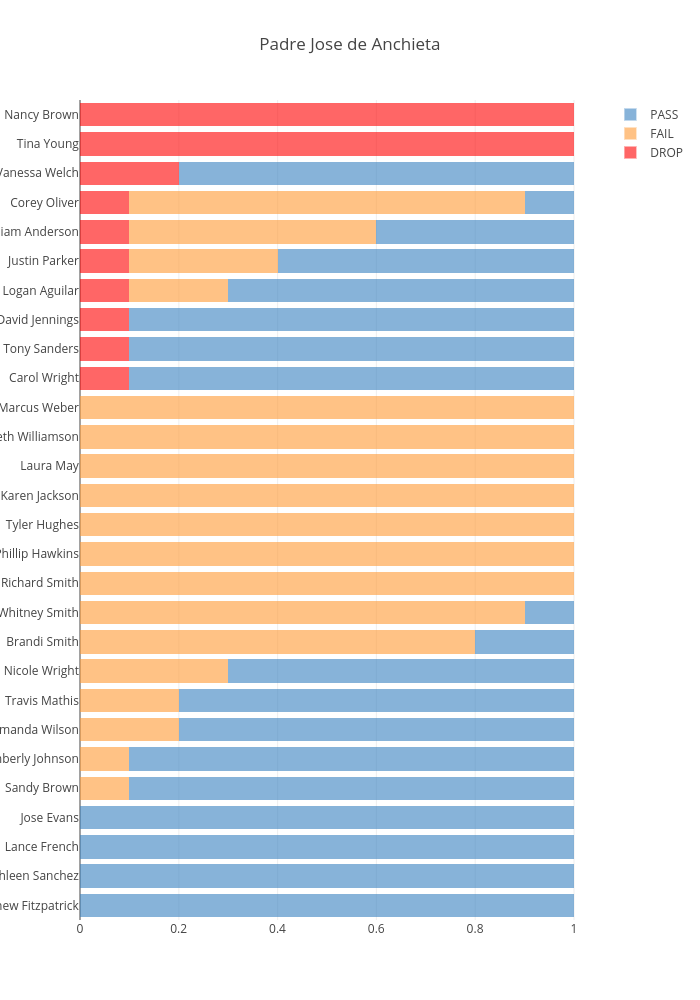
Juliohm's interactive graph and data of "Padre Jose de Anchieta" is a stacked bar chart, showing DROP, FAIL, PASS. The x-axis shows values from 0 to 1.0526315789473684. The y-axis shows values from -0.5 to 27.5.