2000
2005
2010
−5
0
5
40
60
80
100
Public sector net debt
RGDP annual growth rate
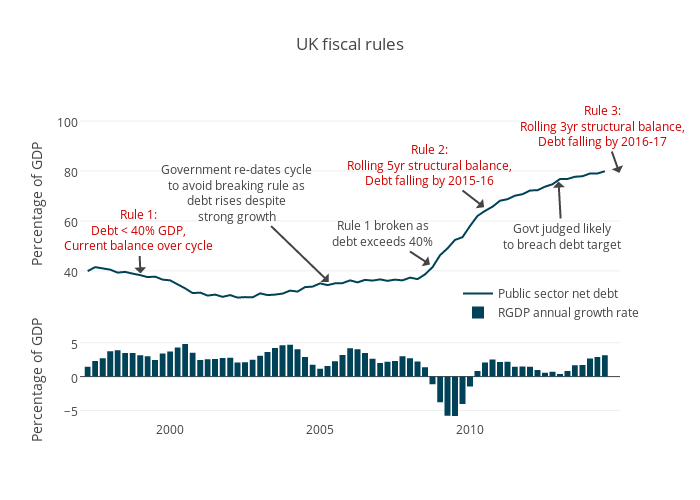
UK fiscal rules
Percentage of GDP
Percentage of GDP
Rule 1:
Debt < 40% GDP,
Current balance over cycle
Government re-dates cycle
to avoid breaking rule as
debt rises despite
strong growth
Rule 1 broken as
debt exceeds 40%
Rule 2:
Rolling 5yr structural balance,
Debt falling by 2015-16
Govt judged likely
to breach debt target
Rule 3:
Rolling 3yr structural balance,
Debt falling by 2016-17
plotly-logomark
Edit chart
Jzuccollo's interactive graph and data of "UK fiscal rules" is a line chart, showing Public sector net debt vs RGDP annual growth rate; with time in the x-axis and Percentage of GDP in the y-axis.. The x-axis shows values from 851716773740 to 1420002026260. The y-axis shows values from -6.414467441833333 to 5.4103680748333325. This visualization has the following annotations: Rule 1:Debt < 40% GDP,Current balance over cycle; Government re-dates cycleto avoid breaking rule asdebt rises despitestrong growth; Rule 1 broken asdebt exceeds 40%; Rule 2:Rolling 5yr structural balance,Debt falling by 2015-16; Govt judged likelyto breach debt target; Rule 3:Rolling 3yr structural balance,Debt falling by 2016-17