1700
1750
1800
1850
1900
1950
2000
2050
0
50
100
150
200
250
www.ukpublicspending.co.uk
OBR Databank (Dec 14)
OBR FSR (Jul 14), C3.17
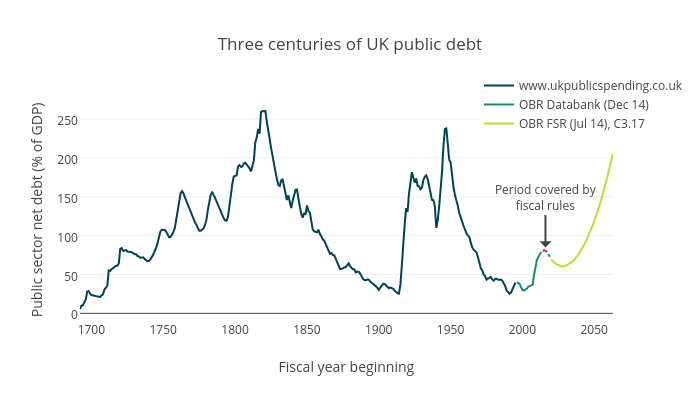
Three centuries of UK public debt
Fiscal year beginning
Public sector net debt (% of GDP)
Period covered by
fiscal rules
plotly-logomark
Edit chart
Jzuccollo's interactive graph and data of "Three centuries of UK public debt" is a line chart, showing www.ukpublicspending.co.uk, OBR Databank (Dec 14), OBR FSR (Jul 14), C3.17, Covered by fiscal rules; with Fiscal year beginning in the x-axis and Public sector net debt (% of GDP) in the y-axis.. The x-axis shows values from 1692 to 2063. The y-axis shows values from -8.541666666666664 to 274.4916666666666. This visualization has the following annotation: Period covered byfiscal rules