Edit chart
Loading graph
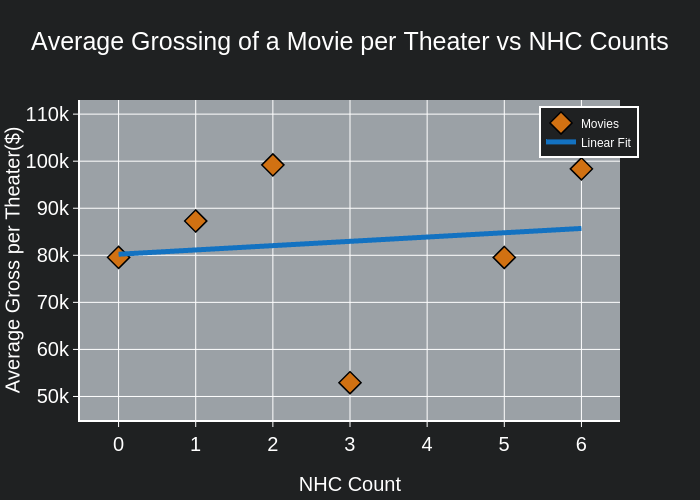
Kaancet's interactive graph and data of "Average Grossing of a Movie per Theater vs NHC Counts" is a scatter chart, showing Movies vs Linear Fit; with NHC Count in the x-axis and Average Gross per Theater($) in the y-axis.. The x-axis shows values from -0.5 to 6.5. The y-axis shows values from 45000 to 113000.