Edit chart
Loading graph
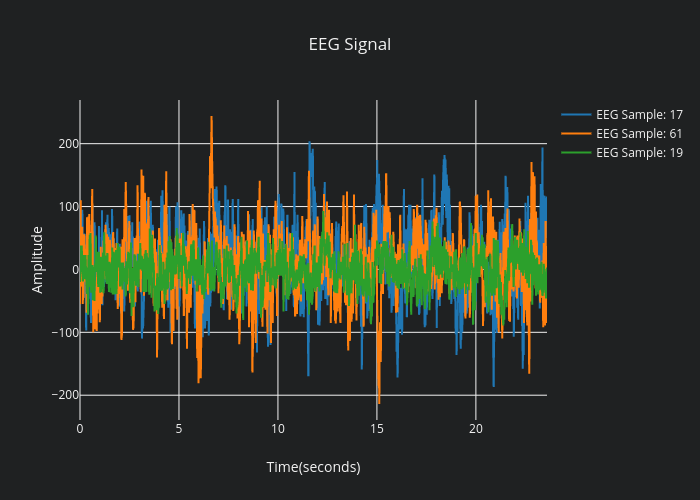
Kaancet's interactive graph and data of "EEG Signal" is a scatter chart, showing EEG Sample: 17, EEG Sample: 61, EEG Sample: 19; with Time(seconds) in the x-axis and Amplitude in the y-axis.. The x-axis shows values from 0 to 0. The y-axis shows values from 0 to 0.