Edit chart
Loading graph
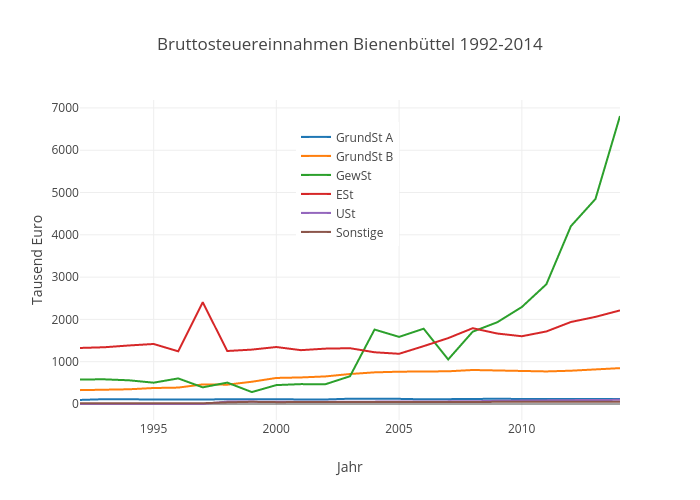
Kalapuskin's interactive graph and data of "Bruttosteuereinnahmen Bienenbüttel 1992-2014" is a scatter chart, showing GrundSt A, GrundSt B, GewSt, ESt, USt, Sonstige; with Jahr in the x-axis and Tausend Euro in the y-axis.. The x-axis shows values from 1992 to 2014. The y-axis shows values from -378.2777777777777 to 7187.277777777777.