Edit chart
Loading graph
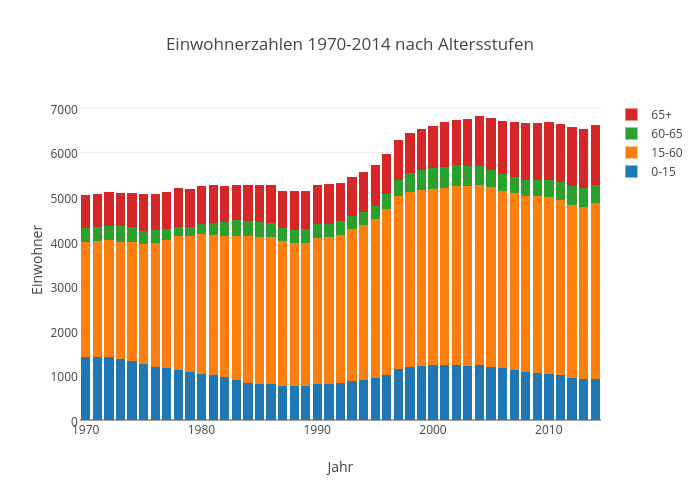
Kalapuskin's interactive graph and data of "Einwohnerzahlen 1970-2014 nach Altersstufen" is a stacked bar chart, showing 0-15, 15-60, 60-65, 65+; with Jahr in the x-axis and Einwohner in the y-axis.. The x-axis shows values from 1969.5 to 2014.5. The y-axis shows values from 0 to 7173.684210526316.