Edit chart
Loading graph
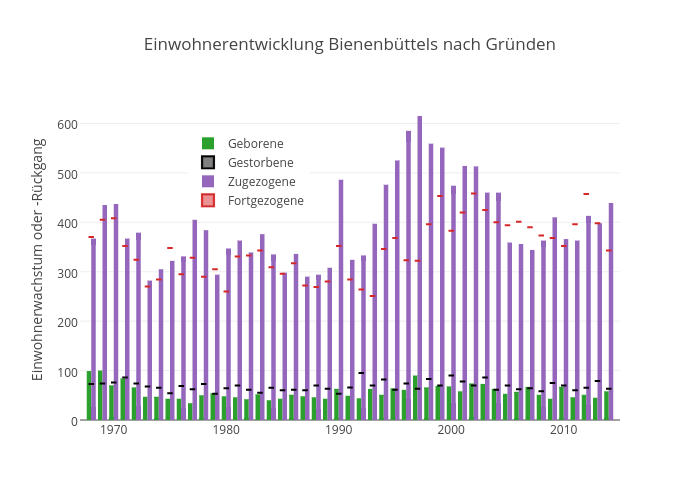
Kalapuskin's interactive graph and data of "Einwohnerentwicklung Bienenbüttels nach Gründen" is a bar chart, showing Geborene, Gestorbene, Zugezogene, Fortgezogene; with Einwohnerwachstum oder -Rückgang in the y-axis. The x-axis shows values from 1967 to 2015. The y-axis shows values from 0 to 647.3684210526316.